Better Sleep Tips.


Better Sleep tips.
More Posts from Ocrim1967 and Others


Yes, The Apollo Moon Landings Really Did Happen
“2.) We have extensive photographic and video evidence from the Apollo missions themselves. How could the lunar module have ascended back off of the surface and returned the astronauts back to the orbiting module which would take them back to Earth? Exactly like the video above shows, from direct Apollo 17 footage. The hypergolic propellant system isn’t based off of a single explosion, but rather a constant thrust of ~16,000 Newtons that was steadily delivered over a timespan of about 5 minutes. There’s no exhaust trail because there’s no lunar atmosphere, but you can track the spacecraft’s accelerated motion for yourself with even basic modern software.”
We’re less than a month away from the official 50th anniversary of the first crewed Moon landing, and there are all sorts of good reasons to celebrate. But for most of us alive today, the final Apollo mission occurred before we were born. Perhaps because of this distance between then and now, there are a great many people who don’t believe that the lunar landings ever occurred. While you might (rightfully) dismiss this position as an uninformed conspiracy, you can also immediately point to a slew of scientific evidence to demonstrate that yes, we did go to the Moon, and here is an enormous suite of data to back that up. From thousands of photographs to suites of instruments and scientific data to an examination of the landing sites today, everything lines up.
Come get the evidence for yourself, and don’t let someone’s conspiracy-minded ravings lead you astray.


(Source)
I love flowers 💐❤️


Make Sure You Observe the Moon on October 20
On Saturday, October 20, NASA will host the ninth annual International Observe the Moon Night. One day each year, everyone on Earth is invited to observe and learn about the Moon together, and to celebrate the cultural and personal connections we all have with our nearest celestial neighbor.
There are a number of ways to celebrate. You can attend an event, host your own, or just look up! Here are 10 of our favorite ways to observe the Moon:
1. Look up

Image credit: NASA’s Scientific Visualization Studio/Ernie Wright
The simplest way to observe the Moon is simply to look up. The Moon is the brightest object in our night sky, the second brightest in our daytime sky and can be seen from all around the world — from the remote and dark Atacama Desert in Chile to the brightly lit streets of Tokyo. On October 20, the near side of the Moon, or the side facing Earth, will be about 80 percent illuminated, rising in the early evening.
See the Moon phase on October 20 or any other day of the year!
2. Peer through a telescope or binoculars

The Moon and Venus are great targets for binoculars. Image Credit: NASA/Bill Dunford
With some magnification help, you will be able to focus in on specific features on the Moon, like the Sea of Tranquility or the bright Copernicus Crater. Download our Moon maps for some guided observing on Saturday.
3. Photograph the Moon

Image credit: NASA/GSFC/ASU
Our Lunar Reconnaissance Orbiter (LRO) has taken more than 20 million images of the Moon, mapping it in stunning detail. You can see featured, captioned images on LRO’s camera website, like the one of Montes Carpatus seen here. And, of course, you can take your own photos from Earth. Check out our tips on photographing the Moon!
4. Take a virtual field trip

Image credit: NASA/JPL-Caltech
Plan a lunar hike with Moontrek. Moontrek is an interactive Moon map made using NASA data from our lunar spacecraft. Fly anywhere you’d like on the Moon, calculate the distance or the elevation of a mountain to plan your lunar hike, or layer attributes of the lunar surface and temperature. If you have a virtual reality headset, you can experience Moontrek in 3D.
5. Touch the topography

Image credit: NASA GSFC/Jacob Richardson
Observe the Moon through touch! If you have access to a 3D printer, you can peruse our library of 3D models and lunar landscapes. This model of the Apollo 11 landing site created by NASA scientist Jacob Richardson, is derived from LRO’s topographic data. Near the center, you can actually feel a tiny dot where astronauts Neil Armstrong and Buzz Aldrin left the Lunar Descent Module.
6. Make Moon art

Image credit: LPI/Andy Shaner
Enjoy artwork of the Moon and create your own! For messy fun, lunar crater paintings demonstrate how the lunar surface changes due to consistent meteorite impacts.
7. Relax on your couch

Image credit: NASA’s Scientific Visualization Studio/Ernie Wright
There are many movies that feature our nearest neighbor, from A Voyage to the Moon by George Melies, to Apollo 13, to the newly released First Man. You can also spend your evening with our lunar playlist on YouTube or this video gallery, learning about the Moon’s role in eclipses, looking at the Moon phases from the far side, and seeing the latest science portrayed in super high resolution. You’ll impress all of your friends with your knowledge of supermoons.
8. Listen to the Moon
Video credit: NASA’s Scientific Visualization Studio/Ernie Wright
Make a playlist of Moon songs. For inspiration, check out this list of lunar tunes. We also recommend LRO’s official music video, The Moon and More, featuring Javier Colon, season 1 winner of NBC’s “The Voice.” Or you can just watch this video featuring “Clair de Lune,” by French composer Claude Debussy, over and over.
9. See the Moon through the eyes of a spacecraft

Image credit: NASA/GSFC/MIT
Visible light is just one tool that we use to explore our universe. Our spacecraft contain many different types of instruments to analyze the Moon’s composition and environment. Review the Moon’s gravity field with data from the GRAIL spacecraft or decipher the maze of this slope map from the laser altimeter onboard LRO. This collection from LRO features images of the Moon’s temperature and topography. You can learn more about our different missions to explore the Moon here.
10. Continue your observations throughout the year

Image credit: NASA’s Scientific Visualization Studio/Ernie Wright
An important part of observing the Moon is to see how it changes over time. International Observe the Moon Night is the perfect time to start a Moon journal. See how the shape of the Moon changes over the course of a month, and keep track of where and what time it rises and sets. Observe the Moon all year long with these tools and techniques!
However you choose to celebrate International Observe the Moon Night, we want to hear about it! Register your participation and share your experiences on social media with #ObserveTheMoon or on our Facebook page. Happy observing!
Make sure to follow us on Tumblr for your regular dose of space: http://nasa.tumblr.com.
NASA’s New Planet Hunter Reveals a Sky Full of Stars

NASA’s newest planet-hunting satellite — the Transiting Exoplanet Survey Satellite, or TESS for short — has just released its first science image using all of its cameras to capture a huge swath of the sky! TESS is NASA’s next step in the search for planets outside our solar system, called exoplanets.

This spectacular image, the first released using all four of TESS’ cameras, shows the satellite’s full field of view. It captures parts of a dozen constellations, from Capricornus (the Sea Goat) to Pictor (the Painter’s Easel) — though it might be hard to find familiar constellations among all these stars! The image even includes the Large and Small Magellanic Clouds, our galaxy’s two largest companion galaxies.
The science community calls this image “first light,” but don’t let that fool you — TESS has been seeing light since it launched in April. A first light image like this is released to show off the first science-quality image taken after a mission starts collecting science data, highlighting a spacecraft’s capabilities.

TESS has been busy since it launched from NASA’s Kennedy Space Center in Cape Canaveral, Florida. First TESS needed to get into position, which required a push from the Moon. After nearly a month in space, the satellite passed about 5,000 miles from the Moon, whose gravity gave it the boost it needed to get into a special orbit that will keep it stable and maximize its view of the sky.

During those first few weeks, we also got a sneak peek of the sky through one of TESS’s four cameras. This test image captured over 200,000 stars in just two seconds! The spacecraft was pointed toward the constellation Centaurus when it snapped this picture. The bright star Beta Centauri is visible at the lower left edge, and the edge of the Coalsack Nebula is in the right upper corner.

After settling into orbit, scientists ran a number of checks on TESS, including testing its ability to collect a set of stable images over a prolonged period of time. TESS not only proved its ability to perform this task, it also got a surprise! A comet named C/2018 N1 passed through TESS’s cameras for about 17 hours in July.
The images show a treasure trove of cosmic curiosities. There are some stars whose brightness changes over time and asteroids visible as small moving white dots. You can even see an arc of stray light from Mars, which is located outside the image, moving across the screen.

Now that TESS has settled into orbit and has been thoroughly tested, it’s digging into its main mission of finding planets around other stars. How will it spot something as tiny and faint as a planet trillions of miles away? The trick is to look at the star!
So far, most of the exoplanets we’ve found were detected by looking for tiny dips in the brightness of their host stars. These dips are caused by the planet passing between us and its star – an event called a transit. Over its first two years, TESS will stare at 200,000 of the nearest and brightest stars in the sky to look for transits to identify stars with planets.

TESS will be building on the legacy of NASA’s Kepler spacecraft, which also used transits to find exoplanets. TESS’s target stars are about 10 times closer than Kepler’s, so they’ll tend to be brighter. Because they’re closer and brighter, TESS’s target stars will be ideal candidates for follow-up studies with current and future observatories.

TESS is challenging over 200,000 of our stellar neighbors to a staring contest! Who knows what new amazing planets we’ll find?
The TESS mission is led by MIT and came together with the help of many different partners. You can keep up with the latest from the TESS mission by following mission updates.
Make sure to follow us on Tumblr for your regular dose of space: http://nasa.tumblr.com.


(Source)

~ wikimedia commons
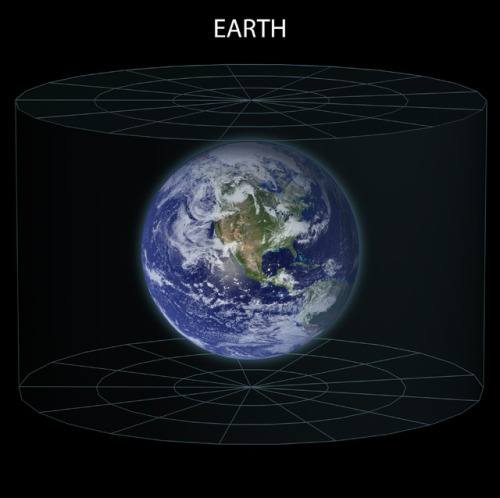
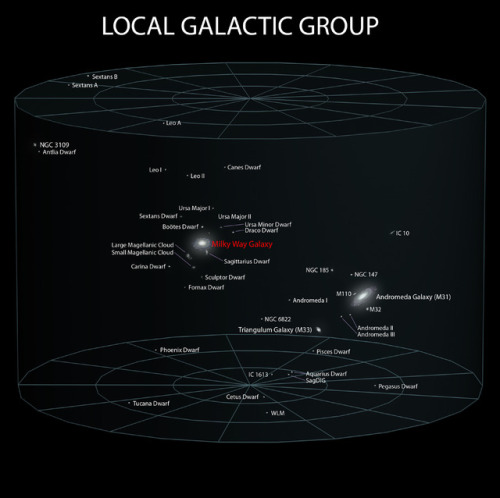
How Big is Our Galaxy, the Milky Way?
When we talk about the enormity of the cosmos, it’s easy to toss out big numbers – but far harder to wrap our minds around just how large, how far and how numerous celestial bodies like exoplanets – planets beyond our solar system – really are.
So. How big is our Milky Way Galaxy?
We use light-time to measure the vast distances of space.
It’s the distance that light travels in a specific period of time. Also: LIGHT IS FAST, nothing travels faster than light.

How far can light travel in one second? 186,000 miles. It might look even faster in metric: 300,000 kilometers in one second. See? FAST.

How far can light travel in one minute? 11,160,000 miles. We’re moving now! Light could go around the Earth a bit more than 448 times in one minute.

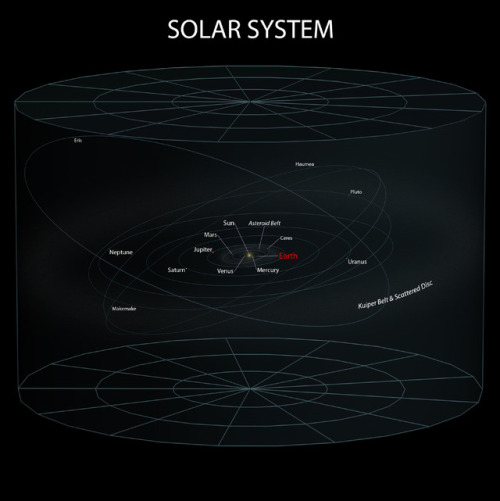
Speaking of Earth, how long does it take light from the Sun to reach our planet? 8.3 minutes. (It takes 43.2 minutes for sunlight to reach Jupiter, about 484 million miles away.) Light is fast, but the distances are VAST.

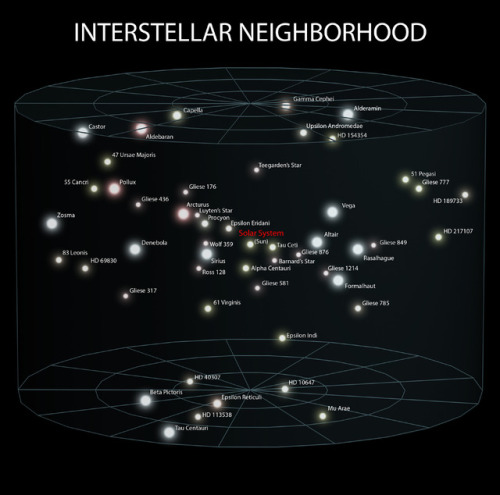
In an hour, light can travel 671 million miles. We’re still light-years from the nearest exoplanet, by the way. Proxima Centauri b is 4.2 light-years away. So… how far is a light-year? 5.8 TRILLION MILES.

A trip at light speed to the very edge of our solar system – the farthest reaches of the Oort Cloud, a collection of dormant comets way, WAY out there – would take about 1.87 years.
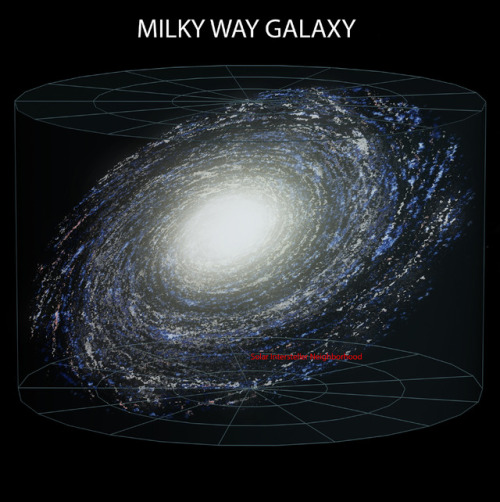
Our galaxy contains 100 to 400 billion stars and is about 100,000 light-years across!
One of the most distant exoplanets known to us in the Milky Way is Kepler-443b. Traveling at light speed, it would take 3,000 years to get there. Or 28 billion years, going 60 mph. So, you know, far.
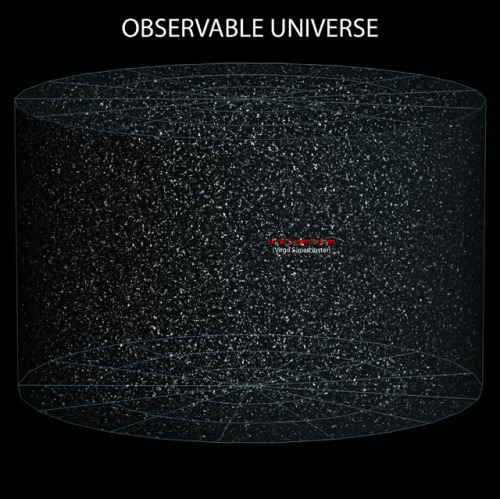
SPACE IS BIG.

Read more here: go.nasa.gov/2FTyhgH
Make sure to follow us on Tumblr for your regular dose of space: http://nasa.tumblr.com.
Hurricanes Have No Place to Hide, Thanks to Better Satellite Forecasts

If you’ve ever looked at a hurricane forecast, you’re probably familiar with “cones of uncertainty,” the funnel-shaped maps showing a hurricane’s predicted path. Thirty years ago, a hurricane forecast five days before it made landfall might have a cone of uncertainty covering most of the East Coast. The result? A great deal of uncertainty about who should evacuate, where it was safe to go, and where to station emergency responders and their equipment.

Over the years, hurricane forecasters have succeeded in shrinking the cone of uncertainty for hurricane tracks, with the help of data from satellites. Polar-orbiting satellites, which fly nearly directly above the North and South Poles, are especially important in helping cut down on forecast error.

The orbiting electronic eyeballs key to these improvements: the Joint Polar Satellite System (JPSS) fleet. A collaborative effort between NOAA and NASA, the satellites circle Earth, taking crucial measurements that inform the global, regional and specialized forecast models that have been so critical to hurricane track forecasts.

The forecast successes keep rolling in. From Hurricanes Harvey, Irma and Maria in 2017 through Hurricanes Florence and Michael in 2018, improved forecasts helped manage coastlines, which translated into countless lives and property saved. In September 2018, with the help of this data, forecasters knew a week ahead of time where and when Hurricane Florence would hit. Early warnings were precise enough that emergency planners could order evacuations in time — with minimal road clogging. The evacuations that did not have to take place, where residents remained safe from the hurricane’s fury, were equally valuable.

The satellite benefits come even after the storms make landfall. Using satellite data, scientists and forecasters monitor flooding and even power outages. Satellite imagery helped track power outages in Puerto Rico after Hurricane Maria and in the Key West area after Hurricane Irma, which gave relief workers information about where the power grid was restored – and which regions still lacked electricity.

Flood maps showed the huge extent of flooding from Hurricane Harvey and were used for weeks after the storm to monitor changes and speed up recovery decisions and the deployment of aid and relief teams.

As the 2019 Atlantic hurricane season kicks off, the JPSS satellites, NOAA-20 and Suomi-NPP, are ready to track hurricanes and tropical cyclones as they form, intensify and travel across the ocean – our eyes in the sky for severe storms.
For more about JPSS, follow @JPSSProgram on Twitter and facebook.com/JPSS.Program, or @NOAASatellites on Twitter and facebook.com/NOAASatellites.
Make sure to follow us on Tumblr for your regular dose of space: http://nasa.tumblr.com.

Shredded Star Leads to Important Black Hole Discovery
This artist’s illustration shows the region around a supermassive black hole after a star wandered too close and was ripped apart by extreme gravitational forces. Some of the remains of the star are pulled into an X-ray-bright disk where they circle the black hole before passing over the “event horizon,” the boundary beyond which nothing, including light, can escape. The elongated spot depicts a bright region in the disk, which causes a regular variation in the X-ray brightness of the source, allowing the spin rate of the black hole to be estimated. The curved region in the upper left shows where light from the other side of the disk has been curved over the top of the black hole.

This event was first detected by a network of optical telescopes called the All-Sky Automated Survey for Supernovae (ASASSN) in November 2014. Astronomers dubbed the new source ASASSN14-li and traced the bright flash of light to a galaxy about 290 million light years from Earth. They also identified it as a “tidal disruption” event, where one cosmic object is shredded by another through gravity.
Astronomers then used other telescopes including a flotilla of high-energy telescopes in space — NASA’s Chandra X-ray Observatory, ESA’s XMM-Newton and NASA’s Neil Gehrels Swift observatory — to study the X-rays emitted as the remains of a star swirled toward the black hole at the center of the galaxy.

The tidal disruption in ASASSN-14li is intriguing because it allowed astronomers to measure the spin rate of the black hole. A black hole has two fundamental properties: mass and spin. While it has been relatively easy for astronomers to determine the mass of black holes, it has been much more difficult to get accurate measurements of their spins.
This debris from the shredded star gave astronomers an avenue to get a direct measure of the black hole’s spin in ASASSN-14li. They found that the event horizon around this black hole is about 300 times the diameter of the Earth, yet rotates once every two minutes (compared to the 24 hours it takes to complete one rotation). This means that the black hole is spinning at least half as fast as the speed of light.

Scientists have determined spin rates for some stellar-mass black holes (those that typically weigh between 5 and 30 solar masses) in our Milky Way galaxy by observing rapid and regular variations in their X-ray brightness. A few supermassive black holes have shown similar variations, but they were only observed to repeat over a few cycles, rather than the 300,000 cycles seen for ASASSN-14li. With only a few cycles, the association of the variations with the spin of the black hole is not secure.
These results will likely encourage astronomers to observe future tidal disruption events for long durations to look for similar, regular variations in their X-ray brightness. source
-
 afronymphet reblogged this · 4 years ago
 -
 xxyeahimweirdxx reblogged this · 4 years ago
 -
 mawiimawii liked this · 4 years ago
 -
 thedreamdata reblogged this · 5 years ago
 -
 modernalternativelifestyle reblogged this · 5 years ago
 -
 sanniesreverie liked this · 5 years ago
 -
 annaparkie liked this · 5 years ago
 -
 fineassvikings reblogged this · 5 years ago
 -
fineassvikings liked this · 5 years ago
-
 sparklybubble-tea liked this · 5 years ago
 -
 american-suffering reblogged this · 5 years ago
 -
 wnmtw liked this · 5 years ago
 -
 aliensbeliewwer liked this · 5 years ago
 -
 theliloes liked this · 5 years ago
 -
 spicywaterboi liked this · 5 years ago
 -
 the-dandelion-darling reblogged this · 5 years ago
 -
 lesbianblair liked this · 5 years ago
 -
 spellboundtothebluequeen reblogged this · 5 years ago
 -
 sparklefunshine liked this · 6 years ago
 -
 xhades-aidoneusx liked this · 6 years ago
 -
 zazai099 liked this · 6 years ago
 -
 xlucik liked this · 6 years ago
 -
 spaceshipsinthedark liked this · 6 years ago
 -
 albertoggonzalez liked this · 6 years ago
 -
 piax-s liked this · 6 years ago
 -
 rudytanuu liked this · 6 years ago
 -
 dahliahsp liked this · 6 years ago
 -
 littlemzlocstar liked this · 6 years ago
 -
 kataliea liked this · 6 years ago
 -
working4betterlife reblogged this · 6 years ago
-
 fallenyetstillup liked this · 6 years ago
 -
 bigquaz1-blog liked this · 6 years ago
 -
 silentsoul1998 reblogged this · 6 years ago
 -
 lesbianstjimmy liked this · 6 years ago
 -
 aznsn0w liked this · 6 years ago
 -
 dinogee reblogged this · 6 years ago
