Psalm 19-1-4


Psalm 19-1-4
More Posts from Ocrim1967 and Others


Better Sleep tips.


Lunar eclipse 2019
Image credit: Dan Wery


General Relativity Rules: Einstein Victorious In Unprecedented Gravitational Redshift Test
“The most interesting part of this result is that it clearly demonstrates the purely General Relativistic effect of gravitational redshift. The observations of S0-2 showcase an exact agreement with Einstein’s predictions, within the measurement uncertainties. When Einstein first conceived of General Relativity, he did so conceptually: with the idea that acceleration and gravitation were indistinguishable to an observer.
With the validation of Einstein’s predictions for the orbit of this star around the galactic center’s black hole, scientists have affirmed the equivalence principle, thereby ruling out or constraining alternative theories of gravity that violate this cornerstone of Einsteinian gravity. Gravitational redshifts have never been measured in environments where gravity is this strong, marking another first and another victory for Einstein. Even in the strongest environment ever probed, the predictions of General Relativity have yet to lead us astray.”
If you want to test Einstein’s General Relativity, you’ll want to look for an effect that it predicts that’s unique, and you’ll want to look for it in the strongest-field regime possible. Well, there’s a black hole at the center of our galaxy with 4 million times the mass of the Sun, and there’s a star (S0-2) that passes closer to it, during closest approach, than any other. In May of 2018, it made this closest approach, coming within 18 billion km (about twice the diameter of Neptune’s orbit) of the black hole, and zipping around at 2.7% the speed of light.
Did Einstein’s predictions for gravitational redshift come out right? You bet they did: 5-sigma, baby! Come get the full, amazing story here!
Ten interesting facts about Saturn
Saturn is sometimes called “The Jewel of the Solar System.” It is a planet that is nothing like our own. Humans have been gazing up at Saturn for a long time. They have been wondering about it for thousands of years.
Here are some fun facts about the Ringed Planet.

Saturn is huge. It is the second largest planet in our Solar System. Jupiter is the only planet that is bigger.

The rings are huge but thin. The main rings could almost go from Earth to the moon. Yet, they are less than a kilometer thick.

Four spacecraft have visited Saturn: Pioneer 11, Voyager 1 and 2, and the Cassini-Huygens mission have all studied the planet.

Saturn has oval-shaped storms similar to Jupiter’s: The region around its north pole has a hexagonal-shaped pattern of clouds. Scientists think this may be a wave pattern in the upper clouds. The planet also has a vortex over its south pole that resembles a hurricane-like storm.

Saturn is made mostly of hydrogen and helium: It exists in layers that get denser farther into the planet. Eventually, deep inside, the hydrogen becomes metallic. At the core lies a hot interior. (click the image for a better resolution).

Saturn has 62 moons: Some of these are large, like Titan, the second largest moon in the Solar System. But most are tiny – just a few km across, and they have no official names. In fact, the last few were discovered by NASA’s Cassini orbiter just a few years ago. More will probably be discovered in the coming years.

Saturn orbits the Sun once every 29.4 Earth years: Its slow movement against the backdrop of stars earned it the nickname of “Lubadsagush” from the ancient Assyrians. The name means “oldest of the old”.

In Saturn there is aurora: Photographic composition made by the Hubble Space Telescope showing the occurrence of aurora in the southern hemisphere of Saturn at intervals of two days.The aurora is visible only in the ultraviolet.

Saturn spins on its axis very fast. A day on Saturn is 10 hours and 14 minutes.

You can see Saturn with your own eyes: Saturn appears as one of the 5 planets visible with the unaided eye. If Saturn is in the sky at night, you can head outside and see it. To see the rings and the ball of the planet itself, you’ll want to peer through a telescope. But you can amaze your friends and family by pointing out that bright star in the sky, and let them know they’re looking at Saturn.
sources: nasa.gov, universetoday.com and solarsystem.nasa.gov


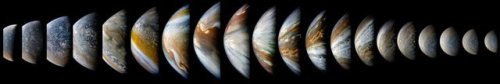
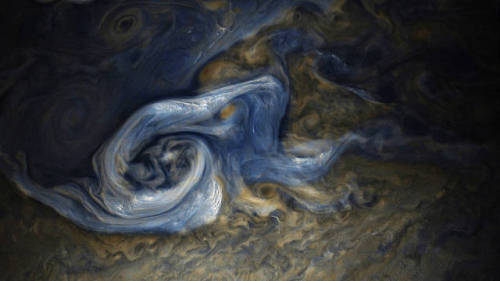
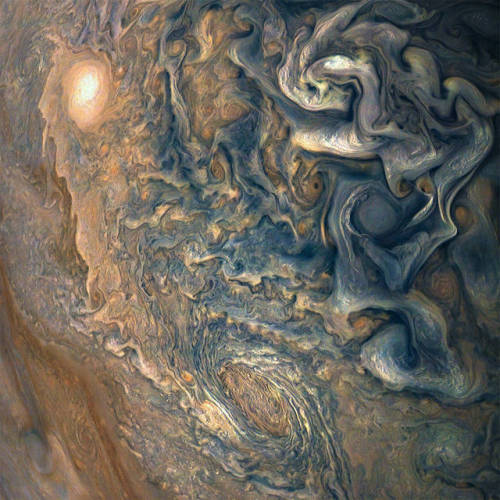
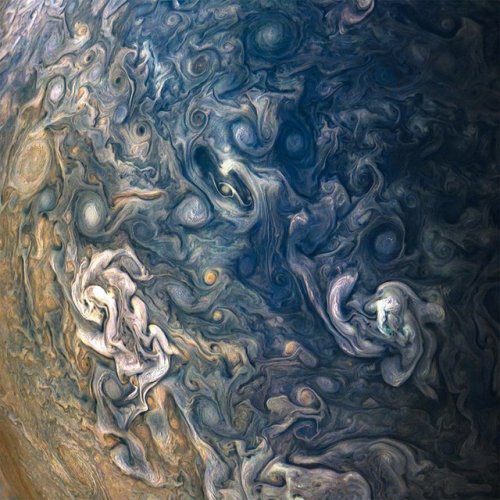
Swirls of Jupiter
Jupiter is a very stormy, turbulent, violent planet. The planet completes a day (or one complete rotation) within roughly 10 hours, which creates massive winds, producing these swirls, and violent storms. The fast rotation coupled with the fact that the planet is nothing but gas greatly multiplies the Coriolis effect. Earth too has a Coriolis effect, this creates the characteristic hurricane shapes and also contributes to the fact that storms will spin the opposite direction in different hemispheres. Luckily, our rotation is slower - our storms are less frequent and less violent than they would be if our days were shorter.
The above images come from the recent Juno mission by NASA.
NASA Science Show & Tell
This week, we’re at one of the biggest science conferences in the country, where our scientists are presenting new results from our missions and projects. It’s called the American Geophysical Union’s Fall Meeting.
Here are a few of the things we shared this week…

The Sun
A few months into its seven-year mission, Parker Solar Probe has already flown far closer to the Sun than any spacecraft has ever gone. The data from this visit to the Sun has just started to come back to Earth, and scientists are hard at work on their analysis.

Parker Solar Probe sent us this new view of the Sun’s outer atmosphere, the corona. The image was taken by the mission’s WISPR instrument on Nov. 8, 2018, and shows a coronal streamer seen over the east limb of the Sun. Coronal streamers are structures of solar material within the Sun’s atmosphere, the corona, that usually overlie regions of increased solar activity. The fine structure of the streamer is very clear, with at least two rays visible. Parker Solar Probe was about 16.9 million miles from the Sun’s surface when this image was taken. The bright object near the center of the image is Mercury, and the dark spots are a result of background correction.
Hurricane Maria
Using a satellite view of human lights, our scientists watched the lights go out in Puerto Rico after Hurricane Maria. They could see the slow return of electricity to the island, and track how rural and mountainous regions took longer to regain power.

In the spring, a team of scientists flew a plane over Puerto Rico’s forests, using a laser instrument to measure how trees were damaged and how the overall structure of the forests had changed.

Earth’s Ice
Our scientists who study Antarctica saw some surprising changes to East Antarctica. Until now, most of the continent’s melting has been on the peninsula and West Antarctica, but our scientists have seen glaciers in East Antarctica lose lots of ice in the last few years.


Our ICESat-2 team showed some of their brand new data. From the changing height of Antarctic ice to lagoons off the coast of Mexico, the little satellite has spent its first few months measuring our planet in 3D. The laser pulses even see individual ocean waves, in this graph.

Scientists are using our satellite data to track Adélie penguin populations, by using an unusual proxy – pictures of their poop! Penguins are too small to be seen by satellites, but they can see large amounts of their poop (which is pink!) and use that as a proxy for penguin populations.

Asteroid Bennu
Our OSIRIS-REx mission recently arrived at its destination, asteroid Bennu. On approach, data from the spacecraft’s spectrometers revealed chemical signatures of water trapped in clay minerals. While Bennu itself is too small to have ever hosted liquid water, the finding indicates that liquid water was present at some time on Bennu’s parent body, a much larger asteroid.
We also released a new, detailed shape model of Bennu, which is very similar to our ground-based observations of Bennu’s shape. This is a boon to ground-based radar astronomy since this is our first validation of the accuracy of the method for an asteroid! One change from the original shape model is the size of the large boulder near Bennu’s south pole, nicknamed “Benben.” The boulder is much bigger than we thought and overall, the quantity of boulders on the surface is higher than expected. Now the team will make further observations at closer ranges to more accurately assess where a sample can be taken on Bennu to later be returned to Earth.

Jupiter
The Juno mission celebrated it’s 16th science pass of #Jupiter, marking the halfway point in data collection of the prime mission. Over the second half of the prime mission — science flybys 17 through 32 — the spacecraft will split the difference, flying exactly halfway between each previous orbit. This will provide coverage of the planet every 11.25 degrees of longitude, providing a more detailed picture of what makes the whole of Jupiter tick.

Mars
The Mars 2020 team had a workshop to discuss the newly announced landing site for our next rover on the Red Planet. The landing site…Jezero Crater! The goal of Mars 2020 is to learn whether life ever existed on Mars. It’s too cold and dry for life to exist on the Martian surface today. But after Jezero Crater formed billions of years ago, water filled it to form a deep lake about the same size as Lake Tahoe. Eventually, as Mars’ climate changed, Lake Jezero dried up. And surface water disappeared from the planet.
Interstellar Space
Humanity now has two interstellar ambassadors. On Nov. 5, 2018, our Voyager 2 spacecraft left the heliosphere — the bubble of the Sun’s magnetic influence formed by the solar wind. It’s only the second-ever human-made object to enter interstellar space, following its twin, Voyager 1, that left the heliosphere in 2012.

Scientists are especially excited to keep receiving data from Voyager 2, because — unlike Voyager 1 — its plasma science instrument is still working. That means we’ll learn brand-new information about what fills the space between the stars.
Learn more about NASA Science at science.nasa.gov.
Make sure to follow us on Tumblr for your regular dose of space: http://nasa.tumblr.com
How Do You Solve a Problem Like Dark Energy?

Here’s the deal — the universe is expanding. Not only that, but it’s expanding faster and faster due to the presence of a mysterious substance scientists have named “dark energy.”
But before we get to dark energy, let’s first talk a bit about the expanding cosmos. It started with the big bang — when the universe started expanding from a hot, dense state about 13.8 billion years ago. Our universe has been getting bigger and bigger ever since. Nearly every galaxy we look at is zipping away from us, caught up in that expansion!

The expansion, though, is even weirder than you might imagine. Things aren’t actually moving away from each other. Instead, the space between them is getting larger.
Imagine that you and a friend were standing next to each other. Just standing there, but the floor between you was growing. You two aren’t technically moving, but you see each other moving away. That’s what’s happening with the galaxies (and everything else) in our cosmos … in ALL directions!

Astronomers expected the expansion to slow down over time. Why? In a word: gravity. Anything that has mass or energy has gravity, and gravity tries to pull stuff together. Plus, it works over the longest distances. Even you, reading this, exert a gravitational tug on the farthest galaxy in the universe! It’s a tiny tug, but a tug nonetheless.
As the space between galaxies grows, gravity is trying to tug the galaxies back together — which should slow down the expansion. So, if we measure the distance of faraway galaxies over time, we should be able to detect if the universe’s growth rate slows down.

But in 1998, a group of astronomers measured the distance and velocity of a number of galaxies using bright, exploding stars as their “yardstick.” They found out that the expansion was getting faster.
Not slowing down.
Speeding up.

⬆️ This graphic illustrates the history of our expanding universe. We do see some slowing down of the expansion (the uphill part of the graph, where the roller coaster is slowing down). However, at some point, dark energy overtakes gravity and the expansion speeds up (the downhill on the graph). It’s like our universe is on a giant roller coaster ride, but we’re not sure how steep the hill is!

Other researchers also started looking for signs of accelerated expansion. And they found it — everywhere. They saw it when they looked at individual stars. They saw it in large scale structures of the universe, like galaxies, galaxy groups and clusters. They even saw it when they looked at the cosmic microwave background (that’s what’s in this image), a “baby picture” of the universe from just a few hundred thousand years after the big bang.
If you thought the roller coaster was wild, hold on because things are about to get really weird.
Clearly, we were missing something. Gravity wasn’t the biggest influence on matter and energy across the largest scales of the universe. Something else was. The name we’ve given to that “something else” is dark energy.

We don’t know exactly what dark energy is, and we’ve never detected it directly. But we do know there is a lot of it. A lot. If you summed up all the “stuff” in the universe — normal matter (the stuff we can touch or observe directly), dark matter, and dark energy — dark energy would make up more than two-thirds of what is out there.
That’s a lot of our universe to have escaped detection!
Researchers have come up with a few dark energy possibilities. Einstein discarded an idea from his theory of general relativity about an intrinsic property of space itself. It could be that this bit of theory got dark energy right after all. Perhaps instead there is some strange kind of energy-fluid that fills space. It could even be that we need to tweak Einstein’s theory of gravity to work at the largest scales.
We’ll have to stay tuned as researchers work this out.

Our Wide Field Infrared Survey Telescope (WFIRST) — planned to launch in the mid-2020s — will be helping with the task of unraveling the mystery of dark energy. WFIRST will map the structure and distribution of matter throughout the cosmos and across cosmic time. It will also map the universe’s expansion and study galaxies from when the universe was a wee 2-billion-year-old up to today. Using these new data, researchers will learn more than we’ve ever known about dark energy. Perhaps even cracking open the case!
You can find out more about the history of dark energy and how a number of different pieces of observational evidence led to its discovery in our Cosmic Times series. And keep an eye on WFIRST to see how this mystery unfolds.
Make sure to follow us on Tumblr for your regular dose of space: http://nasa.tumblr.com


Happy Birthday To Vera Rubin: The Mother Of Our Dark Matter Universe
“Dark matter should drive the formation of structure on all large scales, with every galaxy consisting of a large, diffuse halo of dark matter that is far less dense and more diffuse than the normal matter. While the normal matter clumps and clusters together, since it can stick together and interact, dark matter simply passes through both itself and normal matter. Without dark matter, the Universe wouldn’t match our observations.
But this branch of science truly got its start with the revolutionary work of Vera Rubin. While many, including me, will deride the Nobel committee for snubbing her revolutionary science, she truly did change the Universe. On what would have been her 91st birthday, remember her in her own words:
“Don’t let anyone keep you down for silly reasons such as who you are, and don’t worry about prizes and fame. The real prize is finding something new out there.”
50 years later, we’re still investigating the mystery Vera Rubin uncovered. May there always be more to learn.”
Today, dark matter is practically accepted as a given, owing to an overwhelming suite of evidence that points to its existence. Without adding dark matter as an ingredient, we simply can’t explain the Universe, from gravitational lensing to large-scale structure to Big Bang nucleosynthesis to the cosmic microwave background and much more. But throughout the 1930s, 40s and 50s, no one would even give the idea a second thought. Until, that is, Vera Rubin came along and changed everything.
Today would have been her 91st birthday, and it’s about time you got the scientific story to celebrate what she taught us all.

A high-definition video camera outside the space station captured stark and sobering views of Hurricane Florence, a Category 4 storm. Image Credit: ESA/NASA–A. Gerst

The scene is a late-spring afternoon in the Amazonis Planitia region of northern Mars. The view covers an area about four-tenths of a mile (644 meters) across. North is toward the top. The length of the dusty whirlwind’s shadow indicates that the dust plume reaches more than half a mile (800 meters) in height. The plume is about 30 yards or meters in diameter. Image credit: NASA/JPL-Caltech/Univ. of Arizona

A false-color image of the Great Red Spot of Jupiterfrom Voyager 1. The white oval storm directly below the Great Red Spot has the approximate diameter of Earth. NASA, Caltech/JPL

The huge storm (great white spot) churning through the atmosphere in Saturn’s northern hemisphere overtakes itself as it encircles the planet in this true-color view from NASA’s Cassini spacecraft. Credit: Cassini Imaging Team, SSI, JPL, ESA, NASA; Color Composite: Jean-Luc Dauvergne

The spinning vortex of Saturn’s north polar storm resembles a deep red rose of giant proportions surrounded by green foliage in this false-color image from NASA’s Cassini spacecraft. Measurements have sized the eye at 1,250 miles (2,000 kilometers) across with cloud speeds as fast as 330 miles per hour (150 meters per second). This image is among the first sunlit views of Saturn’s north pole captured by Cassini’s imaging cameras. Credit: NASA/JPL-Caltech/SSI

Colorized infrared image of Uranus obtained on August 6, 2014, with adaptive optics on the 10-meter Keck telescope; white spots are large storms. Image credit: Imke de Pater, University of California, Berkeley / Keck Observatory images.

Neptune’s Great Dark Spot, a large anticyclonic storm similar to Jupiter’s Great Red Spot, observed by NASA’s Voyager 2 spacecraft in 1989. Credit: NASA / Jet Propulsion Lab

This true color image captured by NASA’S Cassini spacecraft before a distant flyby of Saturn’s moon Titan on June 27, 2012, shows a south polar vortex, or a swirling mass of gas around the pole in the atmosphere. Image credit: NASA/JPL-Caltech/Space Science Institute

This artist’s concept shows what the weather might look like on cool star-like bodies known as brown dwarfs. These giant balls of gas start out life like stars, but lack the mass to sustain nuclear fusion at their cores, and instead, fade and cool with time.
New research from NASA’s Spitzer Space Telescope suggests that most brown dwarfs are racked with colossal storms akin to Jupiter’s famous “Great Red Spot.” These storms may be marked by fierce winds, and possibly lightning. The turbulent clouds might also rain down molten iron, hot sand or salts – materials thought to make up the cloud layers of brown dwarfs.
Image credit: NASA/JPL-Caltech/University of Western Ontario/Stony Brook University

In this image, the nightmare world of HD 189733 b is the killer you never see coming. To the human eye, this far-off planet looks bright blue. But any space traveler confusing it with the friendly skies of Earth would be badly mistaken. The weather on this world is deadly. Its winds blow up to 5,400 mph (2 km/s) at seven times the speed of sound, whipping all would-be travelers in a sickening spiral around the planet. And getting caught in the rain on this planet is more than an inconvenience; it’s death by a thousand cuts. This scorching alien world possibly rains glass—sideways—in its howling winds. The cobalt blue color comes not from the reflection of a tropical ocean, as on Earth, but rather a hazy, blow-torched atmosphere containing high clouds laced with silicate particles. Image Credit: ESO/M. Kornmesser
Cosmic rays
Cosmic rays provide one of our few direct samples of matter from outside the solar system. They are high energy particles that move through space at nearly the speed of light. Most cosmic rays are atomic nuclei stripped of their atoms with protons (hydrogen nuclei) being the most abundant type but nuclei of elements as heavy as lead have been measured. Within cosmic-rays however we also find other sub-atomic particles like neutrons electrons and neutrinos.

Since cosmic rays are charged – positively charged protons or nuclei, or negatively charged electrons – their paths through space can be deflected by magnetic fields (except for the highest energy cosmic rays). On their journey to Earth, the magnetic fields of the galaxy, the solar system, and the Earth scramble their flight paths so much that we can no longer know exactly where they came from. That means we have to determine where cosmic rays come from by indirect means.

Because cosmic rays carry electric charge, their direction changes as they travel through magnetic fields. By the time the particles reach us, their paths are completely scrambled, as shown by the blue path. We can’t trace them back to their sources. Light travels to us straight from their sources, as shown by the purple path.

One way we learn about cosmic rays is by studying their composition. What are they made of? What fraction are electrons? protons (often referred to as hydrogen nuclei)? helium nuclei? other nuclei from elements on the periodic table? Measuring the quantity of each different element is relatively easy, since the different charges of each nucleus give very different signatures. Harder to measure, but a better fingerprint, is the isotopic composition (nuclei of the same element but with different numbers of neutrons). To tell the isotopes apart involves, in effect, weighing each atomic nucleus that enters the cosmic ray detector.

All of the natural elements in the periodic table are present in cosmic rays. This includes elements lighter than iron, which are produced in stars, and heavier elements that are produced in violent conditions, such as a supernova at the end of a massive star’s life.

Detailed differences in their abundances can tell us about cosmic ray sources and their trip through the galaxy. About 90% of the cosmic ray nuclei are hydrogen (protons), about 9% are helium (alpha particles), and all of the rest of the elements make up only 1%. Even in this one percent there are very rare elements and isotopes. Elements heavier than iron are significantly more rare in the cosmic-ray flux but measuring them yields critical information to understand the source material and acceleration of cosmic rays.

Even if we can’t trace cosmic rays directly to a source, they can still tell us about cosmic objects. Most galactic cosmic rays are probably accelerated in the blast waves of supernova remnants. The remnants of the explosions – expanding clouds of gas and magnetic field – can last for thousands of years, and this is where cosmic rays are accelerated. Bouncing back and forth in the magnetic field of the remnant randomly lets some of the particles gain energy, and become cosmic rays. Eventually they build up enough speed that the remnant can no longer contain them, and they escape into the galaxy.

Cosmic rays accelerated in supernova remnants can only reach a certain maximum energy, which depends on the size of the acceleration region and the magnetic field strength. However, cosmic rays have been observed at much higher energies than supernova remnants can generate, and where these ultra-high-energies come from is an open big question in astronomy. Perhaps they come from outside the galaxy, from active galactic nuclei, quasars or gamma ray bursts.

Or perhaps they’re the signature of some exotic new physics: superstrings, exotic dark matter, strongly-interacting neutrinos, or topological defects in the very structure of the universe. Questions like these tie cosmic-ray astrophysics to basic particle physics and the fundamental nature of the universe. (source)
-
 dergestein liked this · 6 months ago
 -
 tired-stressed-trying-my-best reblogged this · 6 months ago
 -
tired-stressed-trying-my-best liked this · 6 months ago
-
 blueboxbeagle liked this · 6 months ago
 -
 bear-pattern-hamster liked this · 6 months ago
 -
mackerelshark liked this · 6 months ago
-
smsl241 liked this · 6 months ago
-
 proverbialshipwreck reblogged this · 6 months ago
 -
 livingandthriving liked this · 6 months ago
 -
 freshest-ice liked this · 6 months ago
 -
 requiemforaheroine reblogged this · 6 months ago
 -
requiemforaheroine liked this · 6 months ago
-
 ghostrider-02 reblogged this · 6 months ago
 -
ghostrider-02 liked this · 6 months ago
-
rokusun liked this · 6 months ago
-
 dreadnaughthorizon liked this · 6 months ago
 -
 toyguyuniverse liked this · 6 months ago
 -
 scramblercj8 reblogged this · 6 months ago
 -
scramblercj8 liked this · 6 months ago
-
 lakeside-conservative reblogged this · 6 months ago
 -
 teenageponypandamuffin reblogged this · 6 months ago
 -
 pinestripe37 liked this · 7 months ago
 -
 spirit-truth liked this · 9 months ago
 -
 nerdysunflowerqueen liked this · 9 months ago
 -
 learnorneverrealize1888000888 liked this · 11 months ago
 -
 unlstrawberryangel877 liked this · 1 year ago
 -
 j3nna6259 reblogged this · 1 year ago
 -
 twin-sparrows liked this · 1 year ago
 -
 kaisaccofilm liked this · 1 year ago
 -
 cub-117 liked this · 1 year ago
 -
 godslove reblogged this · 1 year ago
 -
 hernameiscrijansa liked this · 1 year ago
 -
 vtgstyles liked this · 1 year ago
 -
 oveliagirlhaditright reblogged this · 1 year ago
 -
oveliagirlhaditright liked this · 1 year ago
-
 i-love-books-because-reasons reblogged this · 1 year ago
 -
 dominos-pizza-squad liked this · 1 year ago
 -
 mssega117 liked this · 1 year ago
 -
 siorshreabhadh liked this · 1 year ago
 -
 lifeofmarvvel liked this · 1 year ago
 -
 leandrafalconwing reblogged this · 1 year ago
 -
 guarujaa reblogged this · 1 year ago
 -
 panophelia liked this · 1 year ago
