Created Using Still Images Taken By The Cassini Spacecraft During It’s Flyby Of Jupiter And While At

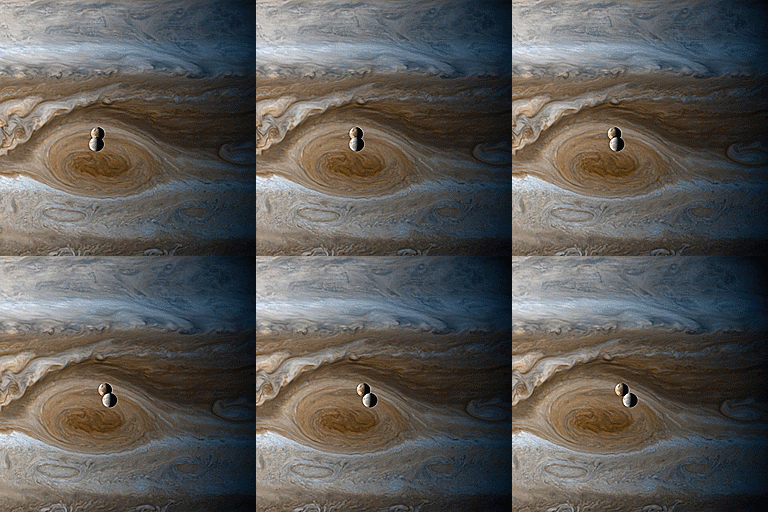
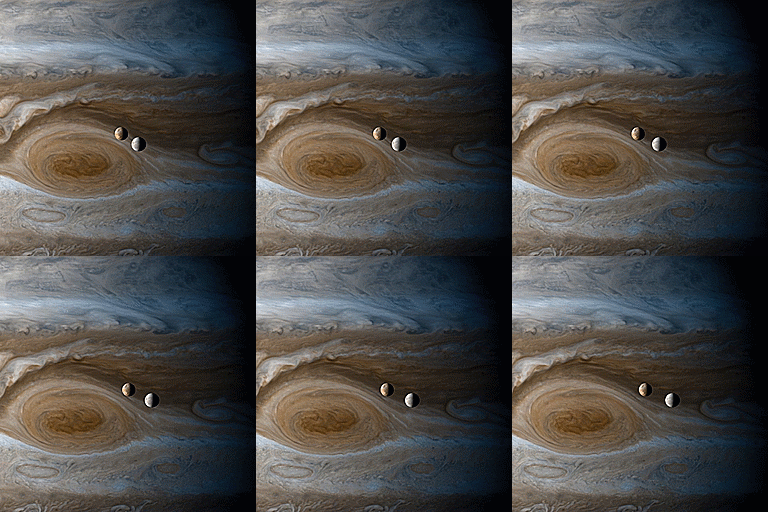
Created using still images taken by the Cassini spacecraft during it’s flyby of Jupiter and while at Saturn. Shown is Io and Europa over Jupiter’s Great Red Spot.
NASA/JPL-Caltech/SSI/CICLOPS/Kevin M. Gill
More Posts from Ocrim1967 and Others
Stellar Winds
Stellar winds are fast moving flows of material (protons, electrons and atoms of heavier metals) that are ejected from stars. These winds are characterised by a continuous outflow of material moving at speeds anywhere between 20 and 2,000 km/s.
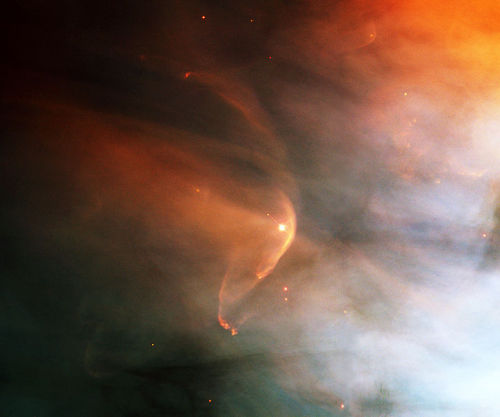
In the case of the Sun, the wind ‘blows’ at a speed of 200 to 300 km/s from quiet regions, and 700 km/s from coronal holes and active regions.
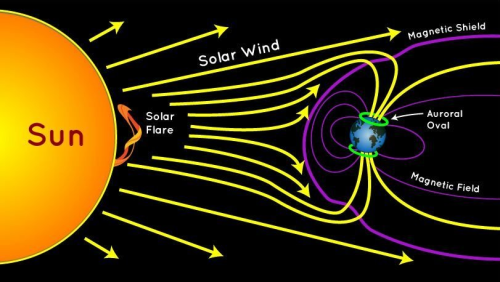
The causes, ejection rates and speeds of stellar winds vary with the mass of the star. In relatively cool, low-mass stars such as the Sun, the wind is caused by the extremely high temperature (millions of degrees Kelvin) of the corona.

his high temperature is thought to be the result of interactions between magnetic fields at the star’s surface, and gives the coronal gas sufficient energy to escape the gravitational attraction of the star as a wind. Stars of this type eject only a tiny fraction of their mass per year as a stellar wind (for example, only 1 part in 1014 of the Sun’s mass is ejected in this way each year), but this still represents losses of millions of tonnes of material each second. Even over their entire lifetime, stars like our Sun lose only a tiny fraction of 1% of their mass through stellar winds.

In contrast, hot, massive stars can produce stellar winds a billion times stronger than those of low-mass stars. Over their short lifetimes, they can eject many solar masses (perhaps up to 50% of their initial mass) of material in the form of 2,000 km/sec winds.

These stellar winds are driven directly by the radiation pressure from photons escaping the star. In some cases, high-mass stars can eject virtually all of their outer envelopes in winds. The result is a Wolf-Rayet star.
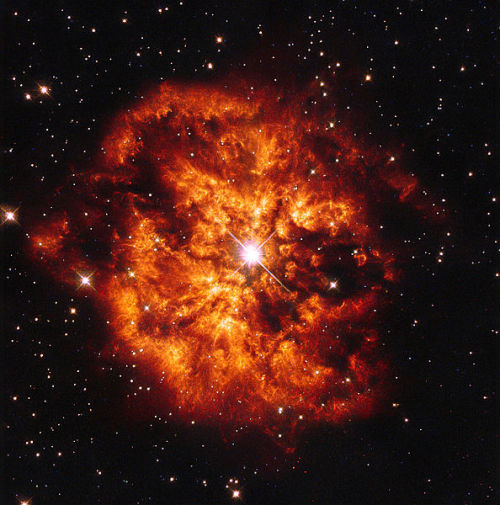
Stellar winds play an important part in the chemical evolution of the Universe, as they carry dust and metals back into the interstellar medium where they will be incorporated into the next generation of stars.
source (read more) + Wolf–Rayet star


Observations of Earth, Soyuz, moon and Space Shuttle Endeavor made from the International Space Station.
source: images.nasa.gov


Lunar eclipse 2019
Image credit: Dan Wery


Read Full Article Here: 6 Tricks to Staying Positive - Psych2Go
Follow @psych2go for more


General Relativity Rules: Einstein Victorious In Unprecedented Gravitational Redshift Test
“The most interesting part of this result is that it clearly demonstrates the purely General Relativistic effect of gravitational redshift. The observations of S0-2 showcase an exact agreement with Einstein’s predictions, within the measurement uncertainties. When Einstein first conceived of General Relativity, he did so conceptually: with the idea that acceleration and gravitation were indistinguishable to an observer.
With the validation of Einstein’s predictions for the orbit of this star around the galactic center’s black hole, scientists have affirmed the equivalence principle, thereby ruling out or constraining alternative theories of gravity that violate this cornerstone of Einsteinian gravity. Gravitational redshifts have never been measured in environments where gravity is this strong, marking another first and another victory for Einstein. Even in the strongest environment ever probed, the predictions of General Relativity have yet to lead us astray.”
If you want to test Einstein’s General Relativity, you’ll want to look for an effect that it predicts that’s unique, and you’ll want to look for it in the strongest-field regime possible. Well, there’s a black hole at the center of our galaxy with 4 million times the mass of the Sun, and there’s a star (S0-2) that passes closer to it, during closest approach, than any other. In May of 2018, it made this closest approach, coming within 18 billion km (about twice the diameter of Neptune’s orbit) of the black hole, and zipping around at 2.7% the speed of light.
Did Einstein’s predictions for gravitational redshift come out right? You bet they did: 5-sigma, baby! Come get the full, amazing story here!

A high-definition video camera outside the space station captured stark and sobering views of Hurricane Florence, a Category 4 storm. Image Credit: ESA/NASA–A. Gerst

The scene is a late-spring afternoon in the Amazonis Planitia region of northern Mars. The view covers an area about four-tenths of a mile (644 meters) across. North is toward the top. The length of the dusty whirlwind’s shadow indicates that the dust plume reaches more than half a mile (800 meters) in height. The plume is about 30 yards or meters in diameter. Image credit: NASA/JPL-Caltech/Univ. of Arizona

A false-color image of the Great Red Spot of Jupiterfrom Voyager 1. The white oval storm directly below the Great Red Spot has the approximate diameter of Earth. NASA, Caltech/JPL

The huge storm (great white spot) churning through the atmosphere in Saturn’s northern hemisphere overtakes itself as it encircles the planet in this true-color view from NASA’s Cassini spacecraft. Credit: Cassini Imaging Team, SSI, JPL, ESA, NASA; Color Composite: Jean-Luc Dauvergne

The spinning vortex of Saturn’s north polar storm resembles a deep red rose of giant proportions surrounded by green foliage in this false-color image from NASA’s Cassini spacecraft. Measurements have sized the eye at 1,250 miles (2,000 kilometers) across with cloud speeds as fast as 330 miles per hour (150 meters per second). This image is among the first sunlit views of Saturn’s north pole captured by Cassini’s imaging cameras. Credit: NASA/JPL-Caltech/SSI

Colorized infrared image of Uranus obtained on August 6, 2014, with adaptive optics on the 10-meter Keck telescope; white spots are large storms. Image credit: Imke de Pater, University of California, Berkeley / Keck Observatory images.

Neptune’s Great Dark Spot, a large anticyclonic storm similar to Jupiter’s Great Red Spot, observed by NASA’s Voyager 2 spacecraft in 1989. Credit: NASA / Jet Propulsion Lab

This true color image captured by NASA’S Cassini spacecraft before a distant flyby of Saturn’s moon Titan on June 27, 2012, shows a south polar vortex, or a swirling mass of gas around the pole in the atmosphere. Image credit: NASA/JPL-Caltech/Space Science Institute

This artist’s concept shows what the weather might look like on cool star-like bodies known as brown dwarfs. These giant balls of gas start out life like stars, but lack the mass to sustain nuclear fusion at their cores, and instead, fade and cool with time.
New research from NASA’s Spitzer Space Telescope suggests that most brown dwarfs are racked with colossal storms akin to Jupiter’s famous “Great Red Spot.” These storms may be marked by fierce winds, and possibly lightning. The turbulent clouds might also rain down molten iron, hot sand or salts – materials thought to make up the cloud layers of brown dwarfs.
Image credit: NASA/JPL-Caltech/University of Western Ontario/Stony Brook University

In this image, the nightmare world of HD 189733 b is the killer you never see coming. To the human eye, this far-off planet looks bright blue. But any space traveler confusing it with the friendly skies of Earth would be badly mistaken. The weather on this world is deadly. Its winds blow up to 5,400 mph (2 km/s) at seven times the speed of sound, whipping all would-be travelers in a sickening spiral around the planet. And getting caught in the rain on this planet is more than an inconvenience; it’s death by a thousand cuts. This scorching alien world possibly rains glass—sideways—in its howling winds. The cobalt blue color comes not from the reflection of a tropical ocean, as on Earth, but rather a hazy, blow-torched atmosphere containing high clouds laced with silicate particles. Image Credit: ESO/M. Kornmesser


NASA Astronauts And Satellites Capture Breathtaking Images Of An Awakening Volcano From Space
“Volcanoes are some of the most fascinating but also dangerous and deadly natural disasters. Fortunately, with appropriate monitoring, they’re one of the most easily mitigated classes of disasters as well. There are approximately 1,500 potentially active volcanoes on Earth at any time, which doesn’t include undersea volcanoes that have not reached the surface or inactive ones that might surprise us.
Only by continuously monitoring the entire Earth at the appropriate resolutions and cadences can we hope to truly minimize the risk to human life and property. Attempts to cut back on this endeavor harm and endanger us all, while an awareness and appreciation for what Earth observing brings us is our greatest asset. May the beauty of these pictures point the way to the most important truth: that comprehensive knowledge and more information are absolutely key to optimally navigating the challenges of being human on our living planet Earth.”
Just a few days ago, on June 22, 2019, a volcano that hadn’t erupted in nearly a century suddenly sprang to life, belching out waves of ash and volcanic gas high into the stratosphere and posing severe threats to nearby life. But far more at-risk were airplanes, which routinely fly through the region where volcanic ash particles were spewed by this eruption. Due to our full suite of Earth observatories, with an assist from astronauts aboard the International Space Station and ground-based monitoring, we were able to minimize the danger and avoid significant damage. Without NASA’s commitment to Earth monitoring, a commitment that’s continually fighting off attempted cuts, mitigating the risks of volcanic eruptions would be hamstrung by humanity’s greatest danger: willful ignorance.
Come take a look at the spectacular story of the recent eruption of Raikoke volcano, and learn why Earth observing is so important in the process!
The Shrinking Aral Sea
The Aral Sea was once the fourth-largest lake in the world. Fed primarily by snowmelt and precipitation flowing down from faraway mountains, it was a temperate oasis in an arid region. But in the 1960s, the Soviet Union diverted two major rivers to irrigate farmland, cutting off the inland sea from its source. As the Aral Sea dried up, fisheries collapsed, as did the communities that depended on them. The remaining water supply became increasingly salty and polluted with runoff from agricultural plots. Loss of the Aral Sea’s water influenced regional climate, making the winters even colder and the summers much hotter.

While seasonal rains still bring water to the Aral Sea, the lake is roughly one-tenth of its original size. These satellite images show how the Aral Sea and its surrounding landscape has changed over the past few decades.
For more details about these images, read the full stories here: https://go.nasa.gov/2PqJ1ot
Make sure to follow us on Tumblr for your regular dose of space: http://nasa.tumblr.com


Gif by Satiricon

Shredded Star Leads to Important Black Hole Discovery
This artist’s illustration shows the region around a supermassive black hole after a star wandered too close and was ripped apart by extreme gravitational forces. Some of the remains of the star are pulled into an X-ray-bright disk where they circle the black hole before passing over the “event horizon,” the boundary beyond which nothing, including light, can escape. The elongated spot depicts a bright region in the disk, which causes a regular variation in the X-ray brightness of the source, allowing the spin rate of the black hole to be estimated. The curved region in the upper left shows where light from the other side of the disk has been curved over the top of the black hole.

This event was first detected by a network of optical telescopes called the All-Sky Automated Survey for Supernovae (ASASSN) in November 2014. Astronomers dubbed the new source ASASSN14-li and traced the bright flash of light to a galaxy about 290 million light years from Earth. They also identified it as a “tidal disruption” event, where one cosmic object is shredded by another through gravity.
Astronomers then used other telescopes including a flotilla of high-energy telescopes in space — NASA’s Chandra X-ray Observatory, ESA’s XMM-Newton and NASA’s Neil Gehrels Swift observatory — to study the X-rays emitted as the remains of a star swirled toward the black hole at the center of the galaxy.

The tidal disruption in ASASSN-14li is intriguing because it allowed astronomers to measure the spin rate of the black hole. A black hole has two fundamental properties: mass and spin. While it has been relatively easy for astronomers to determine the mass of black holes, it has been much more difficult to get accurate measurements of their spins.
This debris from the shredded star gave astronomers an avenue to get a direct measure of the black hole’s spin in ASASSN-14li. They found that the event horizon around this black hole is about 300 times the diameter of the Earth, yet rotates once every two minutes (compared to the 24 hours it takes to complete one rotation). This means that the black hole is spinning at least half as fast as the speed of light.

Scientists have determined spin rates for some stellar-mass black holes (those that typically weigh between 5 and 30 solar masses) in our Milky Way galaxy by observing rapid and regular variations in their X-ray brightness. A few supermassive black holes have shown similar variations, but they were only observed to repeat over a few cycles, rather than the 300,000 cycles seen for ASASSN-14li. With only a few cycles, the association of the variations with the spin of the black hole is not secure.
These results will likely encourage astronomers to observe future tidal disruption events for long durations to look for similar, regular variations in their X-ray brightness. source
-
 spookysublimeprincess liked this · 1 month ago
 -
 macmanusf-blog reblogged this · 1 month ago
 -
 macmanusf-blog liked this · 1 month ago
 -
 belovedmidnighttalks liked this · 2 months ago
 -
 sea70 liked this · 2 months ago
 -
 evefromthenorth liked this · 3 months ago
 -
 eclectichellmouth reblogged this · 3 months ago
 -
 forevermoon reblogged this · 3 months ago
 -
 lathander-babe liked this · 3 months ago
 -
 lavenderstratosphere reblogged this · 3 months ago
 -
 lavenderstratosphere liked this · 3 months ago
 -
 ellasinnombre reblogged this · 3 months ago
 -
 dag--dag reblogged this · 3 months ago
 -
 stardustinthesky reblogged this · 3 months ago
 -
 flakita01 reblogged this · 4 months ago
 -
 cultureshocked liked this · 5 months ago
 -
 referenciacensurada reblogged this · 5 months ago
 -
 meatbiter reblogged this · 5 months ago
 -
 meatbiter liked this · 5 months ago
 -
 dreamsarethings reblogged this · 7 months ago
 -
 backman13 reblogged this · 7 months ago
 -
 hime-ariii liked this · 7 months ago
 -
 anna35foc liked this · 7 months ago
 -
 olithegeek liked this · 7 months ago
 -
 infiniteeighthfloor reblogged this · 7 months ago
 -
 tepagoumrefri liked this · 7 months ago
 -
 helewis liked this · 7 months ago
 -
 solar-edens reblogged this · 7 months ago
 -
 marz-likes-palaces liked this · 7 months ago
 -
 sketchpaperacidfree liked this · 7 months ago
 -
 sl33py-dy liked this · 7 months ago
 -
 masked-ragdoll liked this · 7 months ago
 -
 myrskyisaa liked this · 7 months ago
 -
 sleepiestbutterfly liked this · 7 months ago
 -
 culturalspartanpw reblogged this · 7 months ago
 -
 discorib reblogged this · 7 months ago
 -
 kanene-yaaay-o-retorno reblogged this · 7 months ago
 -
 kanene-yaaay-o-retorno liked this · 7 months ago
 -
 tems-s reblogged this · 7 months ago
 -
 gamegarden reblogged this · 7 months ago
 -
 gamegarden liked this · 7 months ago
 -
 wsdalt reblogged this · 7 months ago
 -
 gayorphandepression reblogged this · 7 months ago
 -
 ratatouier reblogged this · 7 months ago
 -
 routeriver reblogged this · 7 months ago
 -
 xurviving reblogged this · 7 months ago
 -
 galahad1155 reblogged this · 7 months ago
 -
 galahad1155 liked this · 7 months ago